NanoPlot, now in Rust
Wouter De Coster
NanoPlotRustnanoporelong readsquality controlplotting
633 Words · 2 Minutes, 52 Seconds
2026-07-17 10:00
NanoPlot is probably the most widely used of the tools I have written: a quick way to turn a run of long reads into the familiar set of plots and summary statistics — read-length and quality distributions, yield, and, for aligned data, percent identity. It has served people well for years, but it carries the weight of its Python stack: a pandas / plotly environment to install, and runtimes that start to drag on large datasets. So NanoPlot is now also available as a Rust tool, a single self-contained binary that reads the same inputs and produces the same kind of report, faster and with nothing to install around it.
A note on how it was made: I did not port the code to Rust by hand, yet had Claude working under my supervision. I directed the design, made the calls on what the tool should do and which features to implement, and reviewed the result, while Claude wrote and tested the code. I think it is worth being transparent about how this was done.
What you get
Point it at a file and it works out the rest:
nanoplot -i reads.fastq.gz -o output/
The input format is auto-detected from the file content or from stdin. The output is familiar: a NanoStats table, a HTML report, and the expected plots regarding read-length, yields, qualities and percent-identity. Time-resolved views are available from a summary file or fastq rich format: cumulative yield, reads over time, active pores, and length and quality as violins across the run.
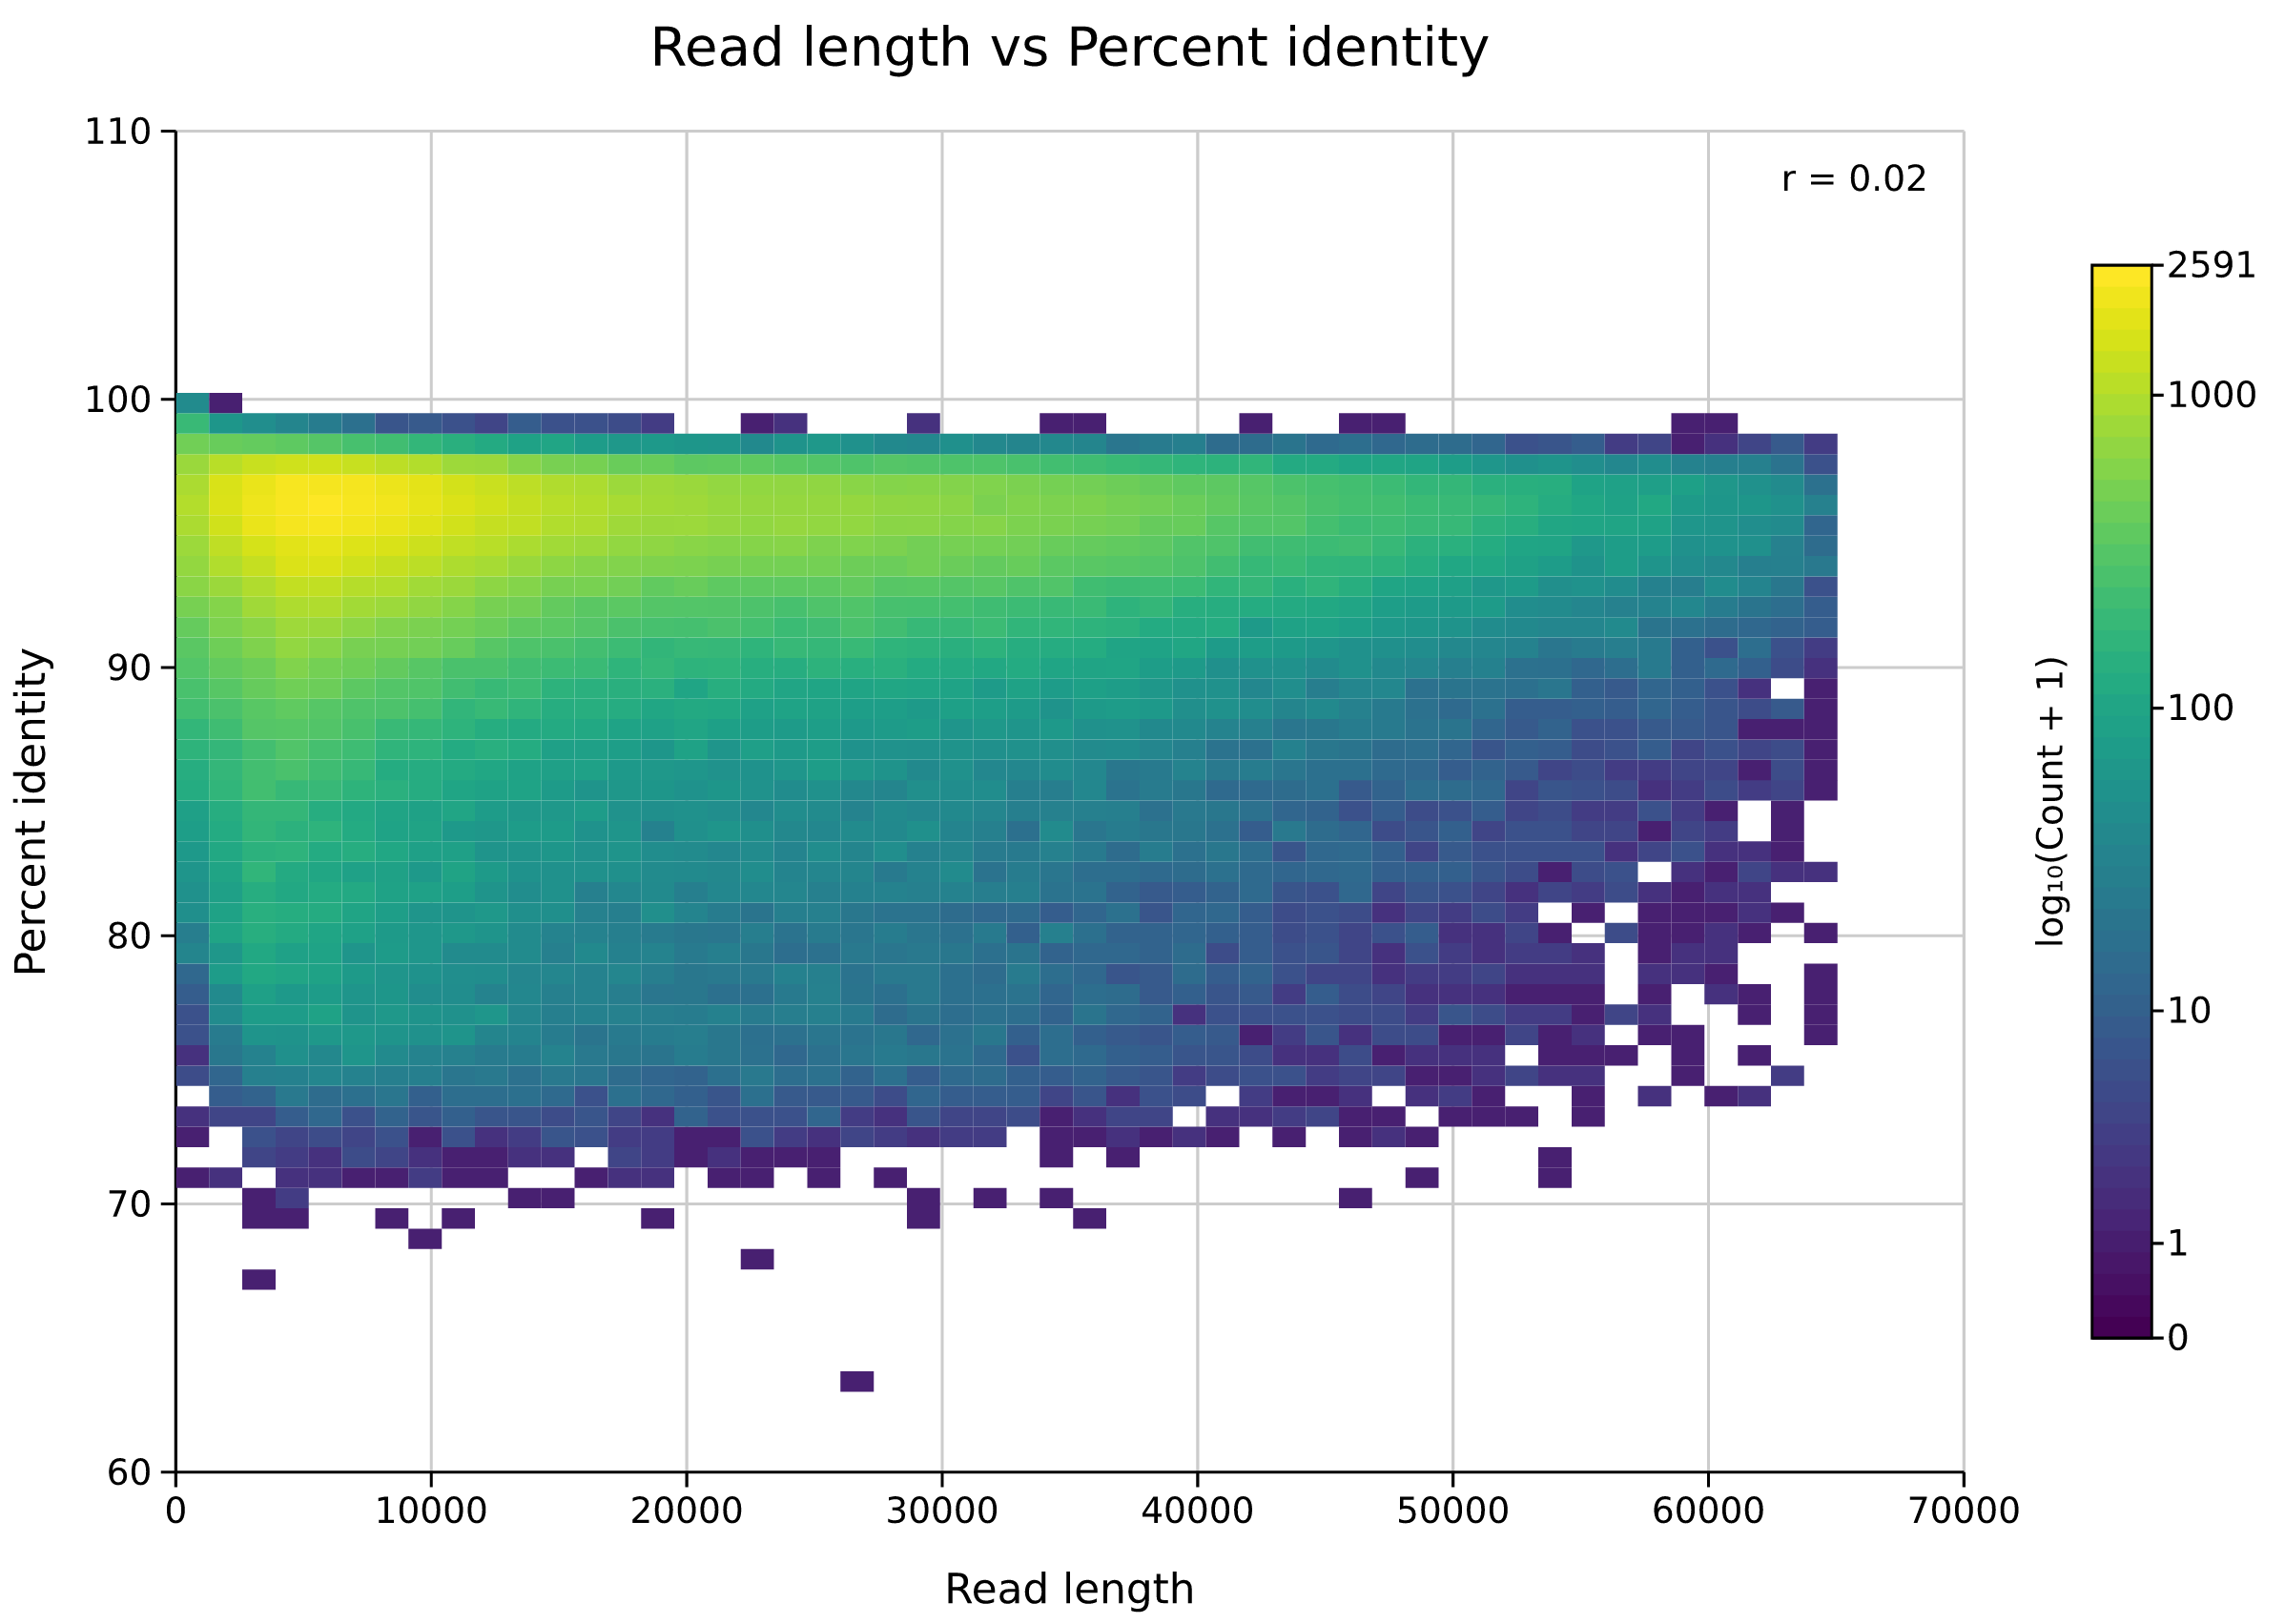
Here is the read-length-versus-percent-identity density plot from a real long-read human genome alignment:
How fast
That plot, and the rest of the report, came out of an 84 GB CRAM of a long-read human genome. On a chr20–22 slice of it (~300,000 reads, 5 Gbases of aligned data), nanoplotrs produced the full set of plots and statistics in 51 seconds. The Python NanoPlot version took just over 7 minutes on the same data with the same number of threads, so the Rust version is at least 8× faster, although an exact benchmark is out of scope for this post. On the full 84 GB alignment — 5.8 million reads, over 100 Gbases — nanoplotrs finishes in about three and a half minutes.
A few nice touches
The statistics go a little further than a plain summary. Alongside the usual N50,
mean and median, the NanoStats table reports how many reads, what fraction, and
how many megabases fall above a set of quality and read-length cutoffs — the kind
of “reads above Q10” / “reads above 50 kb” numbers you usually end up computing by
hand. It stays a clean two-column table, with the same breakdown mirrored in JSON
and rendered in the HTML report.
A couple of details that matter for correctness on aligned data: each read is counted exactly once — secondary alignments are always dropped, and supplementary (split) alignments are excluded by default — so the length and yield numbers are not inflated by chimeric records. And a handful of ultra-long reads no longer flatten your histograms: by default the plots clip the longest 1% of reads for the display only, while the statistics are always computed on every read.
The plots are rendered with kuva, the same Rust scientific-plotting library behind my other recent tools, straight to SVG (or PNG or PDF).
Getting it
Pre-built binaries for Linux (including a static musl build) and macOS are attached to each release:
curl -L -o nanoplot https://github.com/wdecoster/nanoplotrs/releases/latest/download/nanoplot-linux
chmod +x nanoplot
This is a fresh reimplementation rather than a line-for-line copy, so it covers the core of what most people use NanoPlot for rather than every last flag. nanoplotrs is open source and available on GitHub, where the README covers installation and usage. Feedback and feature requests are welcome.