trout: finding tandem repeat outliers in a cohort
Wouter De Coster
troutRusttandem repeatsSTRSTRdustoutliers
741 Words · 3 Minutes, 22 Seconds
2026-06-26 07:00
Shortly ago I wrote about aSTRonaut, a small tool to visualise the motif composition of short tandem repeats. Visualisation is great when you already know which locus to look at — but if you have a whole cohort of genomes and want to know which samples stand out, and where, you need something that screens every locus for you. That is what trout does.
trout (Tandem Repeat OUTliers) takes a cohort of per-sample STRdust VCFs (possibly also from other STR genotypers, but so far untested. Let me know if you run into issues with VCFs from another genotyper) and, at every repeat locus, flags the samples whose alleles are unusual — either unusually long, unusually composed, or both. It is a single dependency-free Rust binary, and it runs over a cohort of more than a thousand genomes in a few seconds.
Why both length and composition
For tandem repeats, length is the obvious thing to look at: most pathogenic expansions are simply long. But length is not the whole story. At RFC1 a benign AAAAG allele and a disease-causing AAGGG allele can be the same size — what differs is the motif composition. A screen that only looks at allele length would miss exactly that kind of signal.
So trout describes each allele by two things at once: its length, and its k-mer composition (the frequencies of the canonical repeat motifs in the sequence). Every allele becomes a point in that combined feature space, and trout uses DBSCAN to find the dense cluster of “normal” alleles at each locus. Anything that falls outside the cluster is reported as an outlier, together with which axis it deviated on — length, or a specific motif.
Some examples
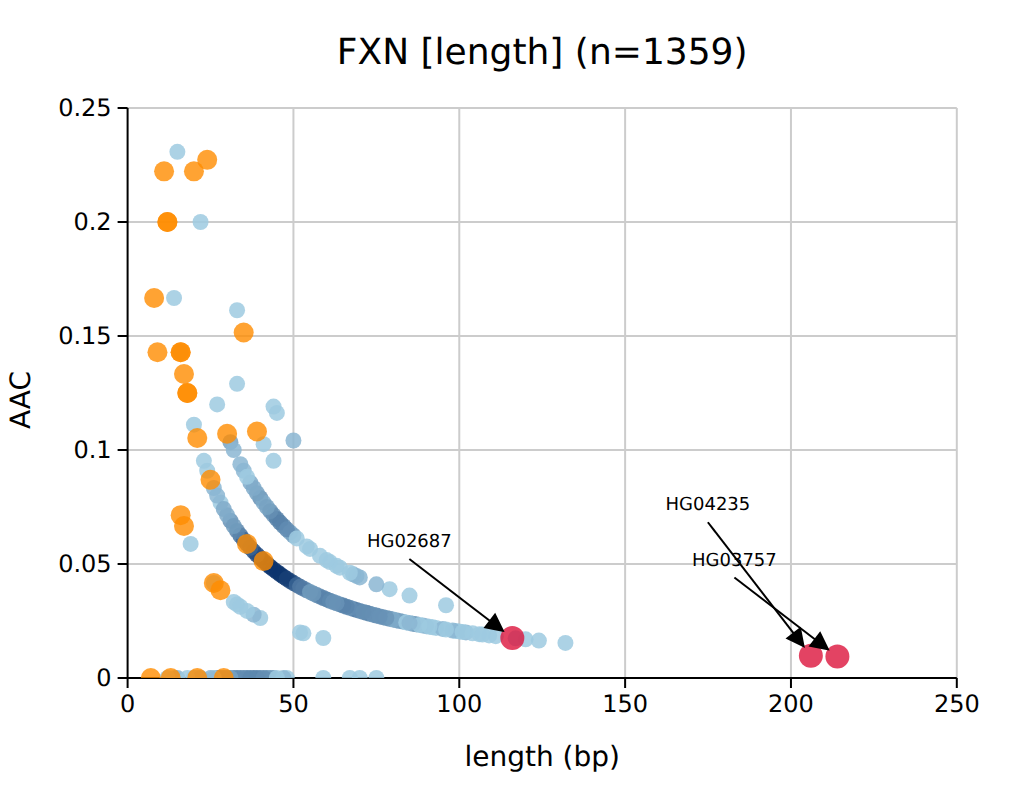
Here is the FXN locus (the GAA repeat behind Friedreich ataxia) across a cohort of long-read genomes. The bulk of the cohort sits as a dense cloud of short alleles; two samples (in red) sit far out to the right at ~210 bp — clear length outliers, exactly the kind of expansion you are screening for.
And here is a composition example at DMPK. On the length axis these samples are unremarkable, but their alleles are unusually rich in the CGG motif (vertical axis), so they sit well above the cohort cloud. A length-only screen would never have flagged them.
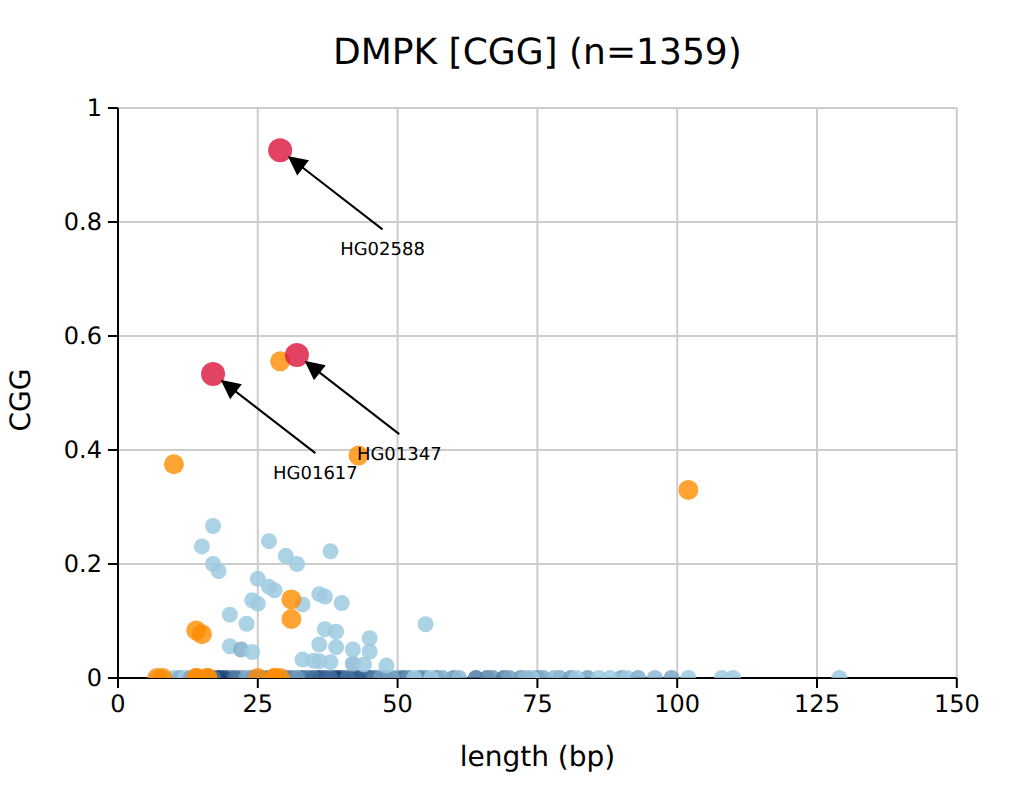
Each plot focuses on one axis, and the colours encode how a sample relates to it. Red points are the outliers on the axis shown — the length axis in the first plot, the CGG axis in the second — and they are the ones labelled with the sample name. Orange points are samples that trout flagged as outliers on a different axis; they are drawn for context so you can see, for example, that a length outlier is not also a composition outlier (and vice versa). Everything else is the density-shaded normal cloud, where darker means more samples stack on that spot, so a single marker never hides hundreds of samples. The plots are written straight to SVG and are built to stay openable even for large cohorts.
Using it
The basic invocation is just a glob of VCFs:
trout cohort/*.vcf.gz > outliers.tsv
That writes one row per outlier sample per locus. The rest of the options, including filtering and tuning the sensitivity, the output columns, and the algorithm details are documented in the repository. The plots are rendered with kuva, and trout reads the same STRdust VCFs as aSTRonaut, so the two tools sit naturally side by side: trout finds the loci and samples worth a closer look, aSTRonaut shows you what is going on at the sequence level.
trout can pick the k-mer length per locus on its own (-k auto), detecting the motif period from the sequence — so a trinucleotide locus is scored on trinucleotides and a hexanucleotide locus on hexamers, without you specifying anything. It also writes a per-sample QC summary with a robust z-score, which is handy for spotting samples that come up as outliers everywhere (usually a coverage or contamination problem rather than biology).
How this was built
In the interest of transparency: trout was not written by hand. The code was written and tested by Claude, Anthropic’s coding agent, working under my supervision — I directed the design, decided what the tool should do and which features to add, and reviewed the result.
trout is open source and available on GitHub. Feedback and feature requests are welcome.