aSTRonaut, now in Rust
Wouter De Coster
aSTRonautRusttandem repeatsSTRpathSTR
421 Words · 1 Minute, 54 Seconds
2026-06-25 07:00
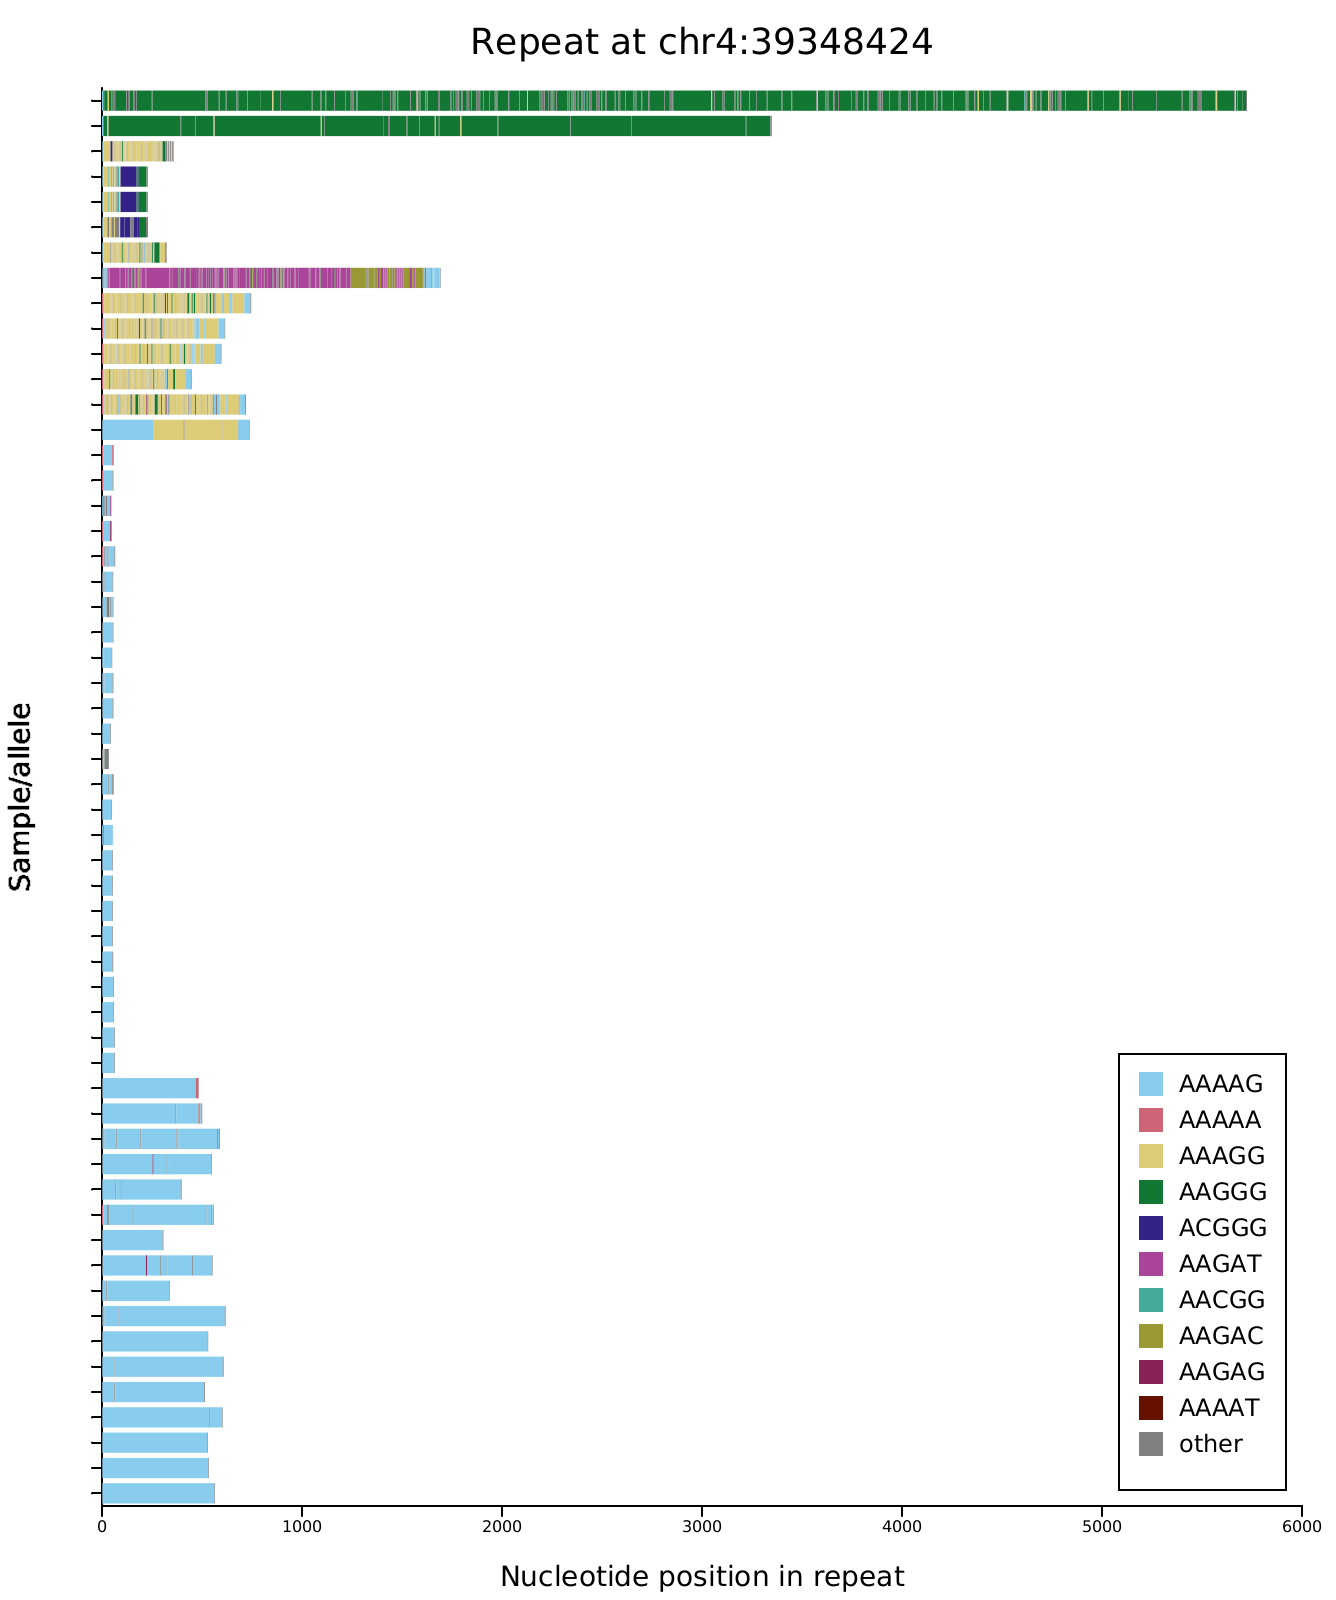
For tandem repeat expansion, the length of the repeat is only part of the story and the motif composition can be just as important, as for some loci a change in motif composition is what makes a repeat pathogenic. RFC1 is the classic example: a benign AAAAG allele
and a disease-causing AAGGG expansion can be the same size, with dramatically different consequences.
To make that visible, pathSTR draws repeats with sequence-motif plots with one row per sample, each nucleotide coloured by the motif it belongs to. It is a simple idea, visually appealing, and remarkably informative. Of course I am not the first one to come up with such a visualization, sometimes also called a waterfall plot. The standalone version of that PathSTR visualization is a Python script called aSTRonaut, which is now also available as a Rust program for speed and simplicity: a single small binary with no dependencies that produces self-contained HTML files.
A note on how it was made: I did not write the Rust by hand. The port was carried out by Claude, Anthropic’s coding agent, working under my supervision. I directed the design, made the calls on what the tool should do and which features to implement, and reviewed the result, while Claude wrote and tested the code. It was a genuinely productive way to work, and I think it is worth being transparent about it.
What it looks like
Here is RFC1 across VCFs from pathSTR, with the rows clustered by motif composition. The benign AAAAG alleles (light blue) sit together at the bottom, the rare AAGGG expansions (dark green) stand out at the top, and a handful of other motif variants fall in between.
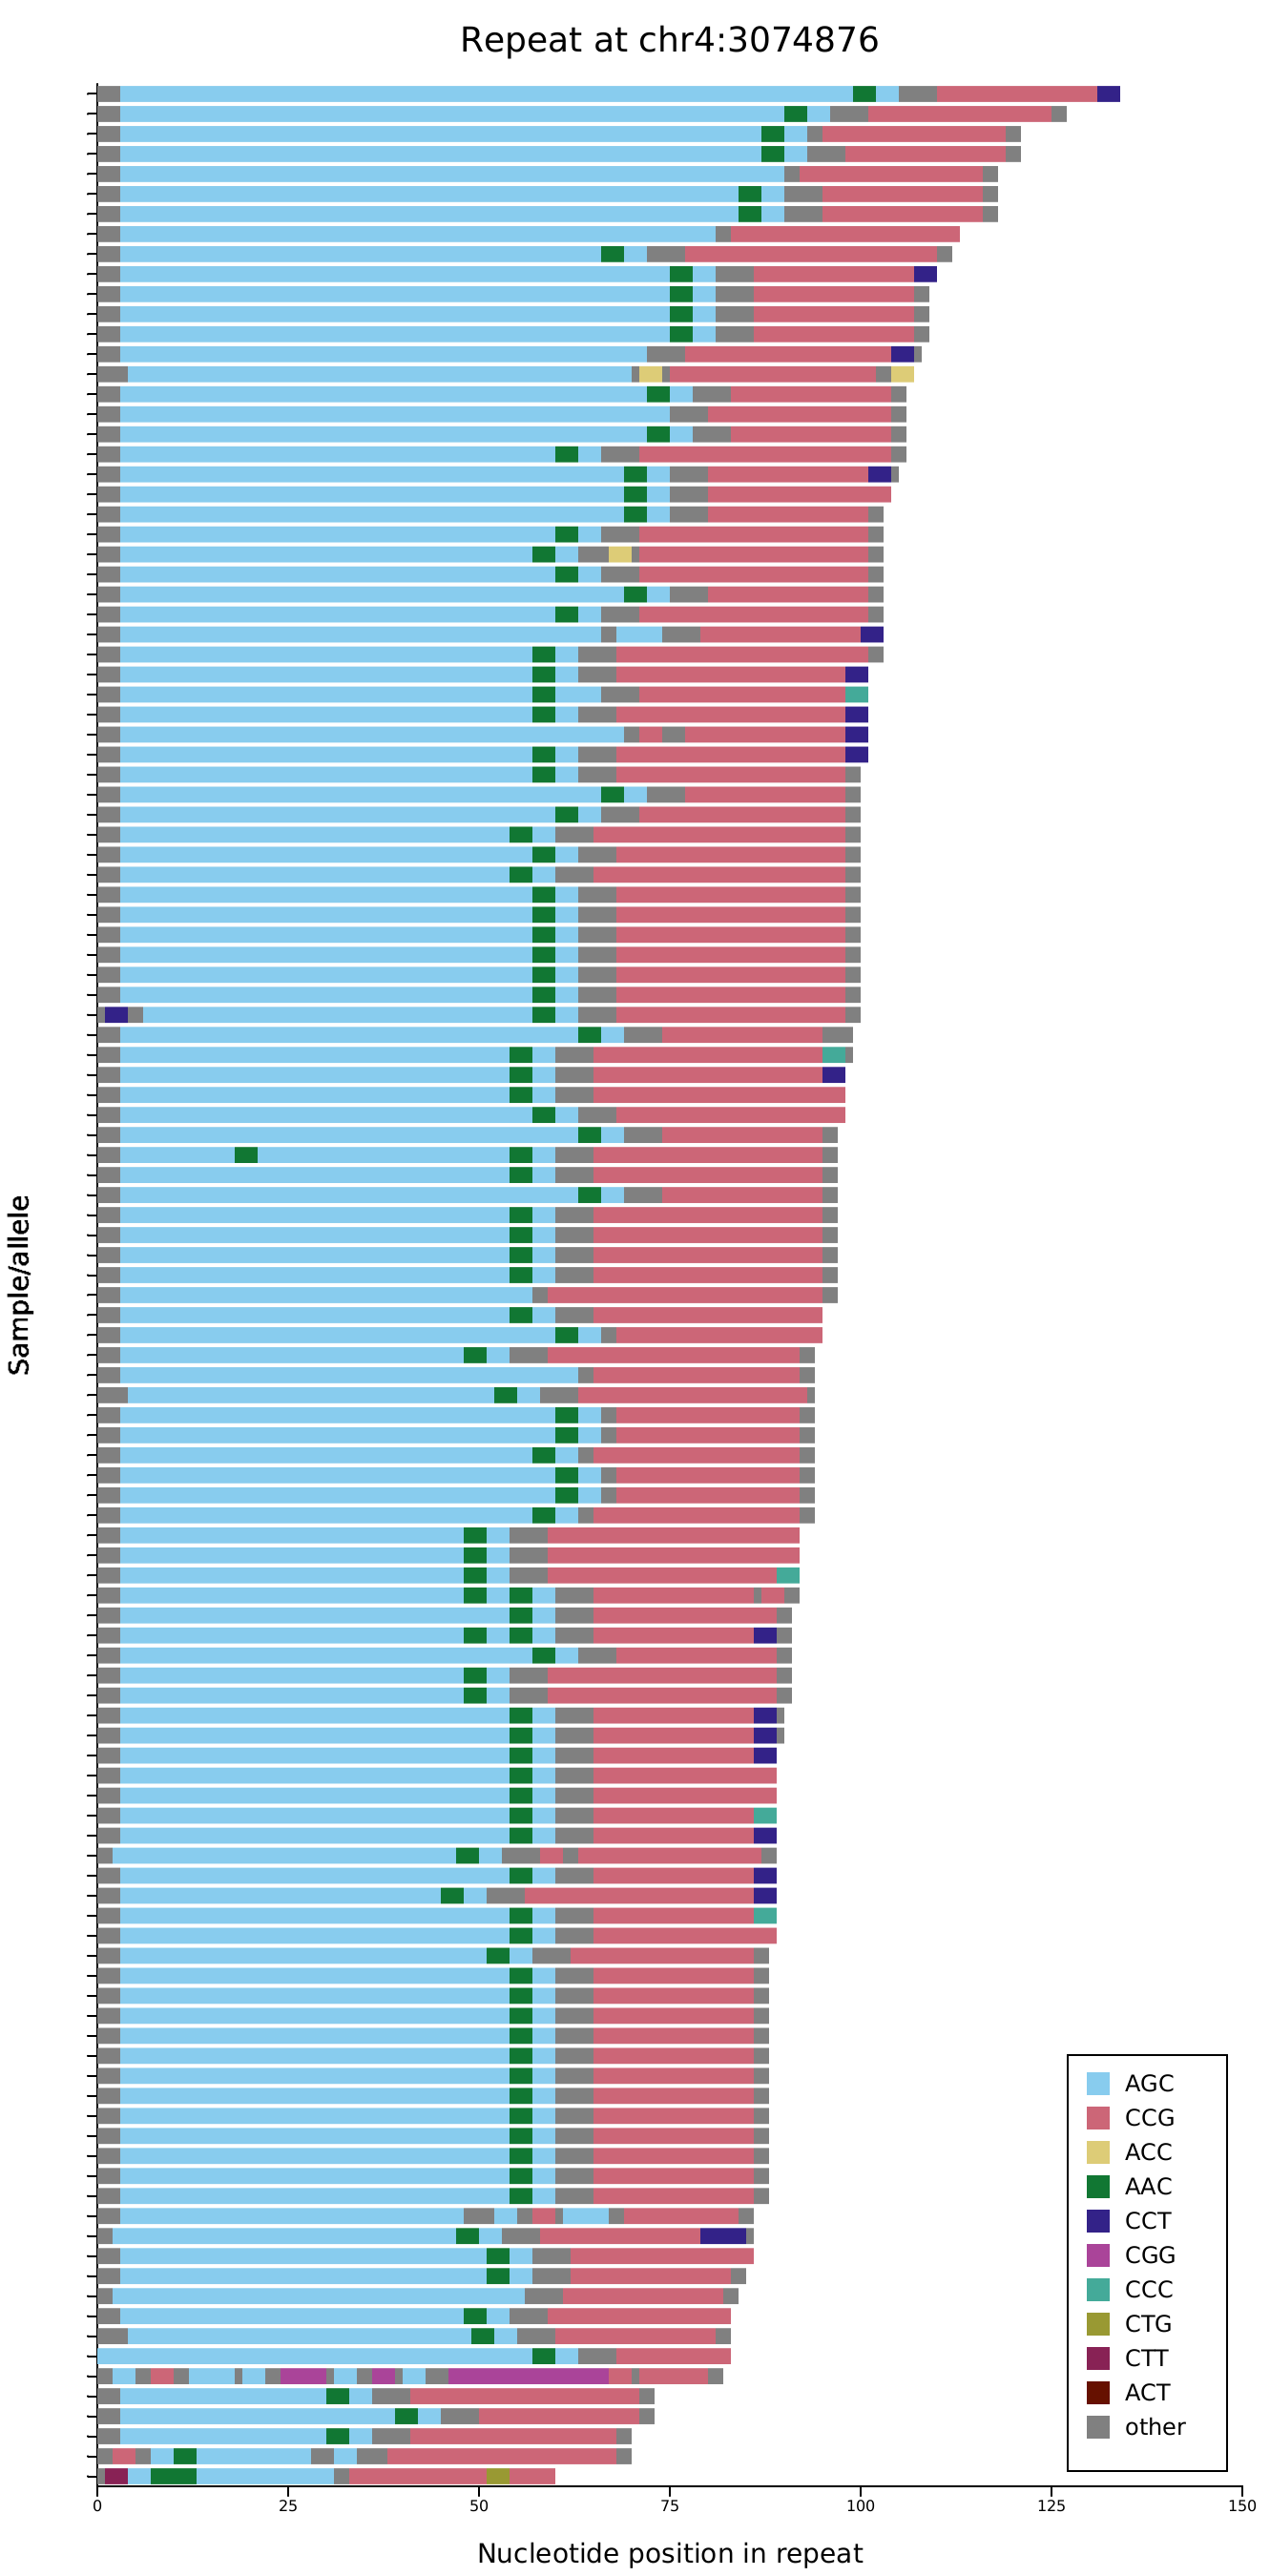
Similarly, here is the HTT CAG repeat behind Huntington’s disease: the polyglutamine CAG tract (blue) grows in length from
top to bottom, followed by the CCG-rich tail (pink), with the occasional interruption breaking up the pattern.
A couple of new tricks
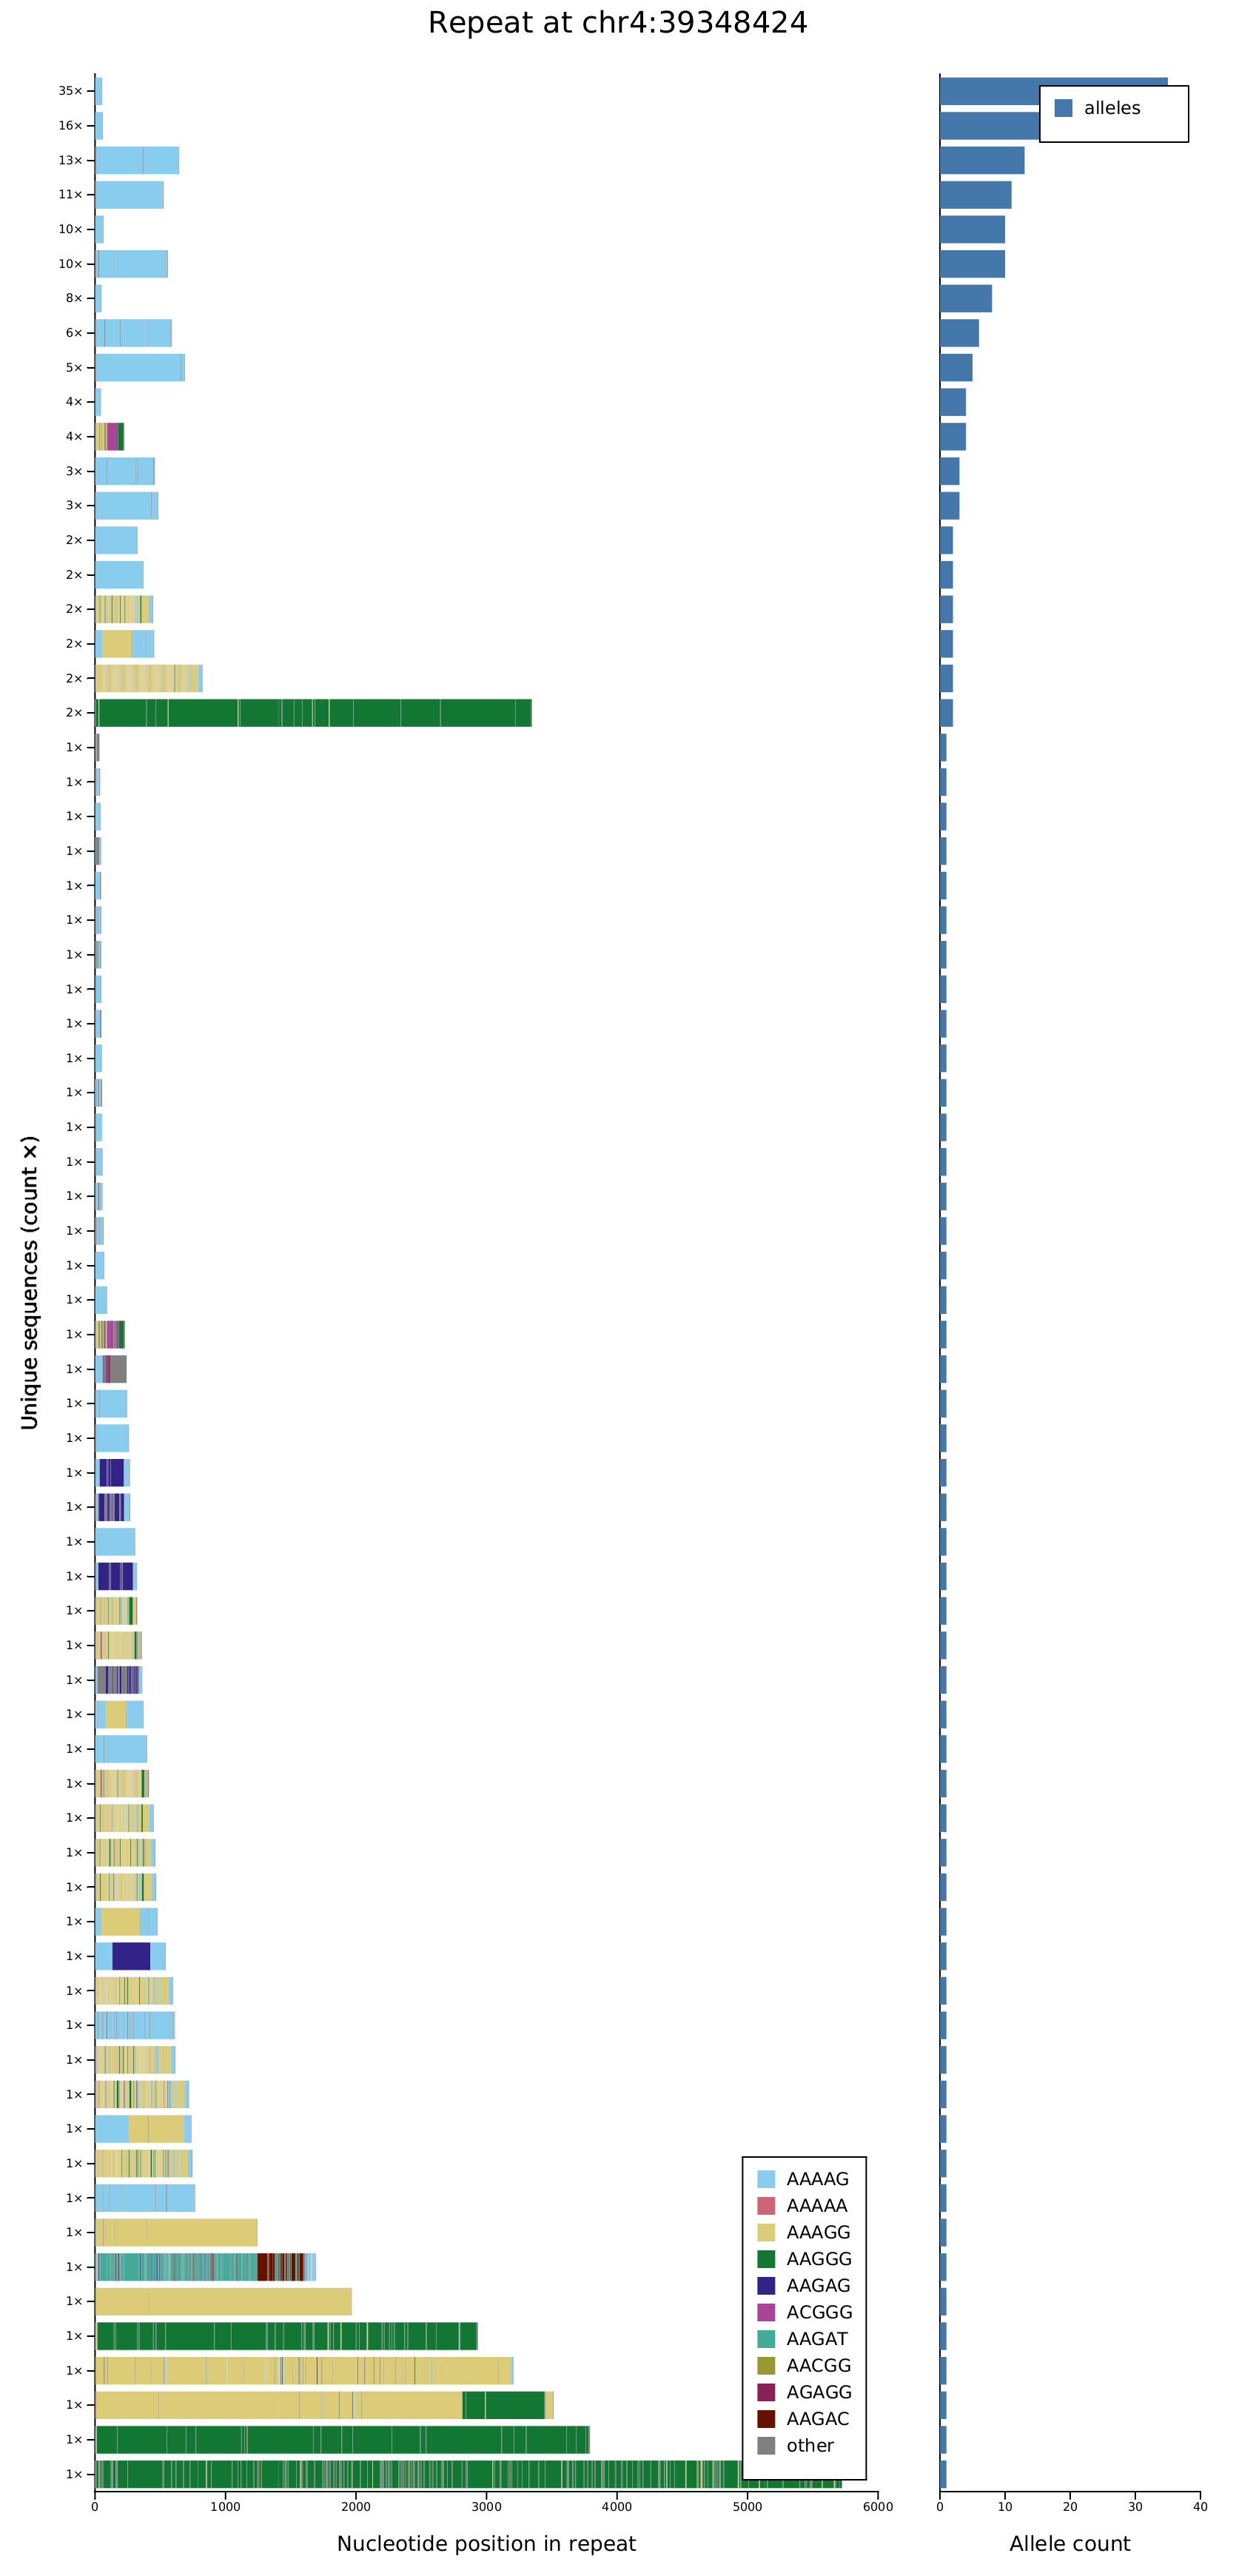
The Rust version also comes with a few new features. It can guess the repeat motif length for each locus on its own (-k auto), so you do not have to specify it. And it can collapse identical alleles into a haplotype-frequency view, where each unique sequence becomes a single row next to a bar showing how many people carry it.
The plots are rendered with kuva, a lovely new Rust scientific-plotting library. The example plots above use data from the pathSTR database.
aSTRonaut is open source and available on GitHub, with documentation. Feedback and feature requests are welcome.