Evaluating ONT barcode combinations
When using native barcoding kits from ONT we have noticed some low frequency miss-assignments between barcodes/samples. Now we don’t know if this is an issue from the wet lab side (cross contamination, or an issue during ligation), or if this is a bioinformatics issue (demultiplexing errors).
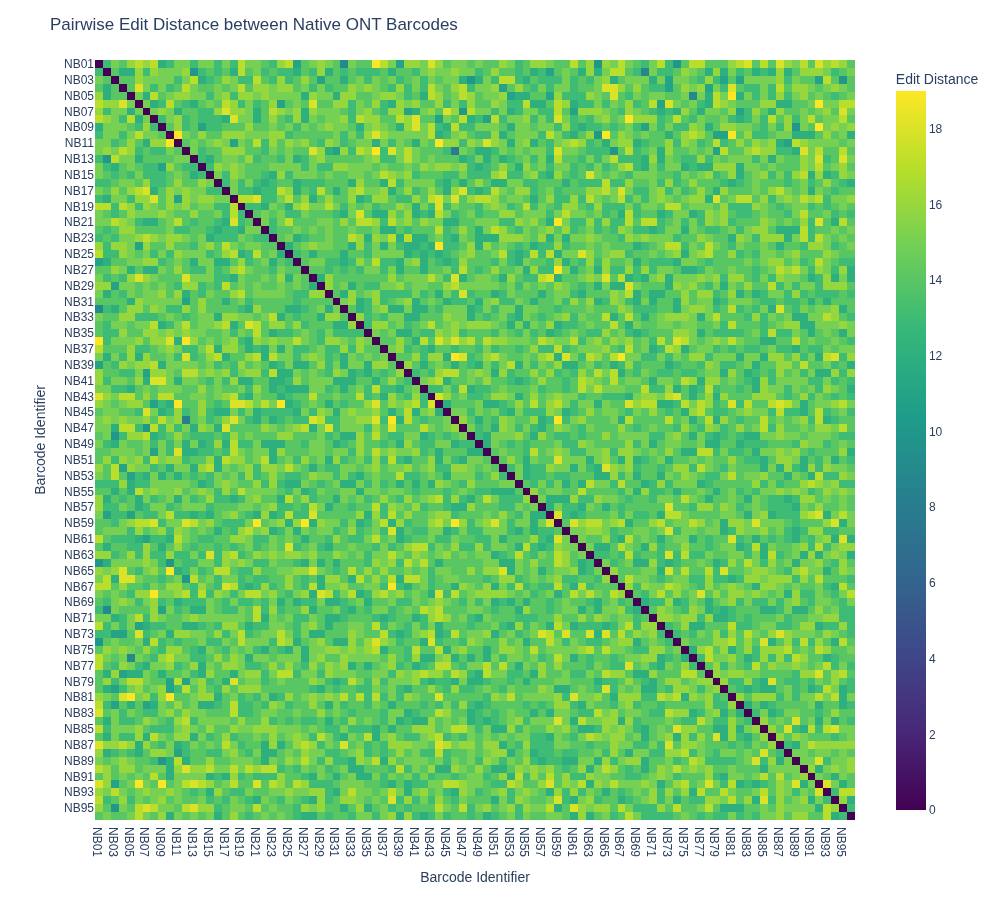
In order to maximise the possibility for the demultiplexing tool to distinguish between barcodes, I evaluated the pairwise edit distance across the 96 native barcodes (available in the chemistry technical document). I saved the barcodes in barcodes.txt, to compute the pairwise edit distance between each pair of barcodes using the Levenshtein package in Python, filling a distance matrix.
import Levenshtein
import pandas as pd
import plotly.express as px

# Load the barcode data
barcodes_df = pd.read_csv('barcodes.txt', sep='\t')
barcodes = barcodes_df['Sequence'].tolist()
identifiers = barcodes_df['Identifier'].tolist()

# Initialize a distance matrix
n = len(barcodes)
distance_matrix = pd.DataFrame(index=identifiers, columns=identifiers)
# Compute pairwise edit distances
for i in range(n):
    for j in range(n):
        distance = Levenshtein.distance(barcodes[i], barcodes[j])
        distance_matrix.iloc[i, j] = distance

# Make a heatmap visualization using plotly
fig = px.imshow(distance_matrix.astype(int),
                labels=dict(x="Barcode Identifier", y="Barcode Identifier", color="Edit Distance"),
                x=identifiers,
                y=identifiers,
                color_continuous_scale='Viridis')
fig.update_layout(title='Pairwise Edit Distance between Native ONT Barcodes')
fig.write_image('barcode_edit_distance_heatmap.png', width=1000, height=900)
This results in the image below, showing that there is quite some variability in the edit distance.
The next goal is to select a set of 5 barcodes that maximise the pairwise edit distance in this set, which requires evaluating 61,124,064 combinations of 5 barcodes. This can be parallelised to greatly speed up the process.
from itertools import combinations
from multiprocessing import Pool, cpu_count
from tqdm import tqdm
import numpy as np

# Convert to numpy for much faster access
distance_array = distance_matrix.values.astype(float)

def calculate_combo_distance(combo):
    """Calculate total pairwise distance for a combination of indices"""
    total = 0
    for i in combo:
        for j in combo:
            if i != j:
                total += distance_array[i, j]
    return total, combo

# Generate all combinations
all_combos = list(combinations(range(n), 5))
print(f"Evaluating {len(all_combos):,} combinations...")

# Parallelize the computation
with Pool(cpu_count() - 1) as pool:
    results = list(tqdm(
        pool.imap(calculate_combo_distance, all_combos, chunksize=1000),
        total=len(all_combos),
        desc="Finding most distant barcodes"
    ))

# Find the best combination
max_distance, best_combination = max(results, key=lambda x: x[0])

print(f"\nMost distant barcodes (total distance: {max_distance:.0f}):")
for idx in best_combination:
    print(f"{identifiers[idx]}: {barcodes[idx]}")
This results in the following list of barcodes that are maximally distant from each other:
Most distant barcodes (total distance: 340):
NB01: CACAAAGACACCGACAACTTTCTT
NB05: AAGGTTACACAAACCCTGGACAAG
NB36: ATGTCCCAGTTAGAGGAGGAAACA
NB44: AGTAGAAAGGGTTCCTTCCCACTC
NB81: CCTCATCTTGTGAAGTTGTTTCGG
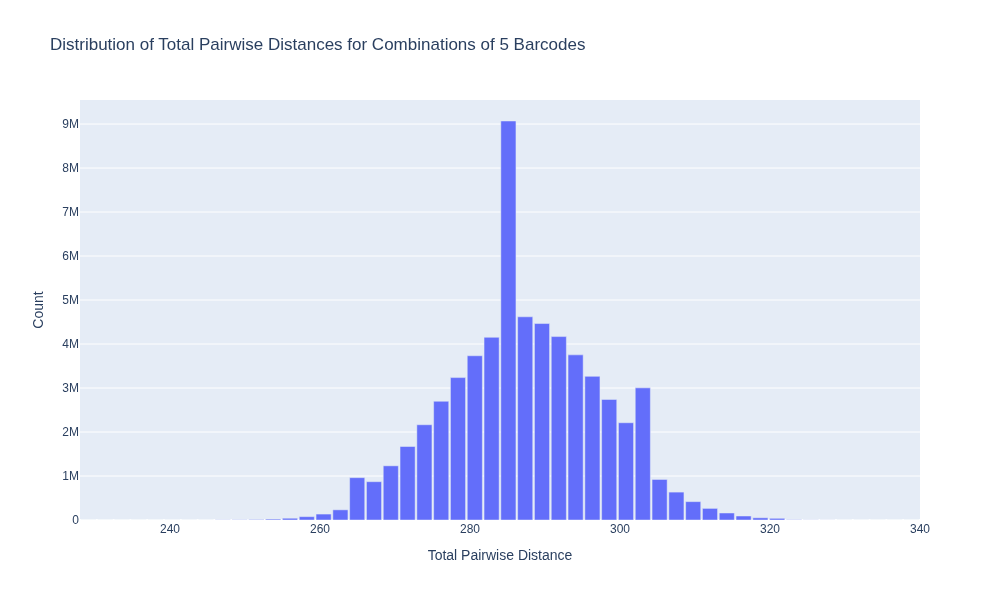
I was also wondering what the average distance is between random combinations of 5 barcodes.
mean_distance = np.mean([res[0] for res in results])
print(f"\nMean total distance between all combinations of 5 barcodes: {mean_distance:.0f}")
The mean total distance for a set of 5 barcodes is 287.Then, what is the full distance if you just pick barcodes 1-5 from the kit:
total_distance = next(res[0] for res in results if res[1] == (0, 1, 2, 3, 4))
print(f"\nTotal distance between barcodes 1-5: {total_distance}")
This results in a distance of 276, so worse than the average combination and much worse than the optimal combination. Finally, I wanted to visualize a histogram of all distances to see the distribution. As I don’t want an HTML file with all combinations stored in memory, I precompute the histogram bins and counts and plot these as a bar chart.
import plotly.graph_objects as go
distances = [res[0] for res in results]

counts, bin_edges = np.histogram(distances, bins=50)
bin_centers = (bin_edges[:-1] + bin_edges[1:]) / 2

fig_density = go.Figure()
fig_density.add_trace(go.Bar(x=bin_centers, y=counts, name='Total Distances'))
fig_density.update_layout(title='Distribution of Total Pairwise Distances for Combinations of 5 Barcodes',
                          xaxis_title='Total Pairwise Distance',
                          yaxis_title='Count',
                          bargap=0.1)
fig_density.write_image('barcode_distance_distribution.png', width=1000, height=600)
Which looks like: