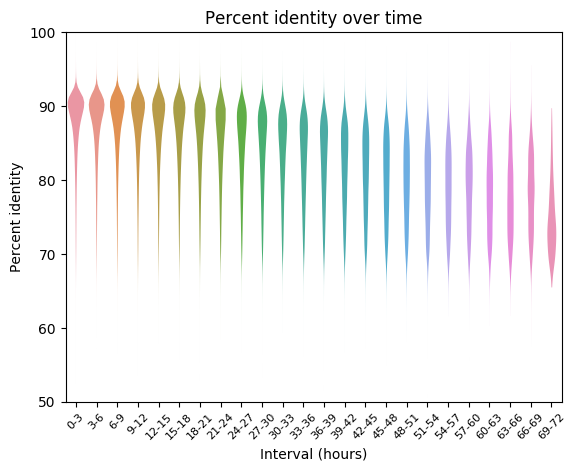
Nanopore sequencing: percent identity over time
My NanoPlot tool includes plots showing the decline in base call quality and sequencing speed over time, see below.
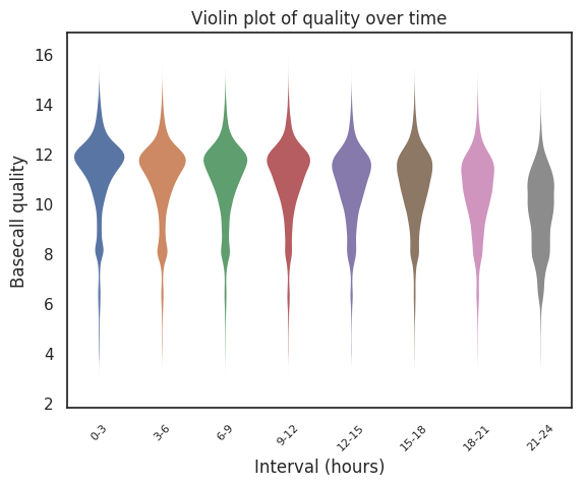
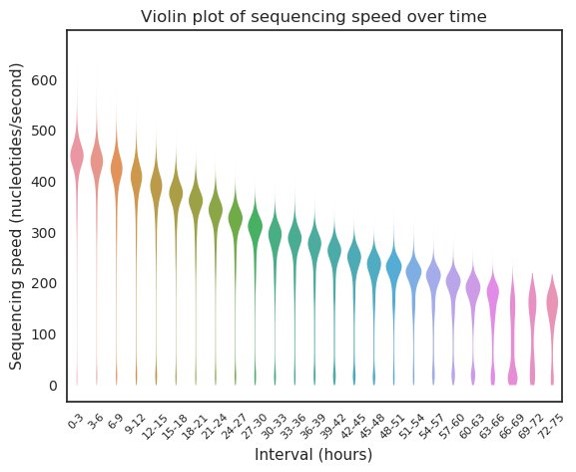
Sequencing speed reduction is presumably because the ATP in the fuel mix gets consumed, or pores start wearing out. However, I wondered if this lower quality near the end of the run was also reflected in lower percent identity, or it was just misjudged by the basecaller. But this requires getting data from the alignment and from a summary file, as the time at sequencing is lost after alignment. NanoPlot can create a pickle file to save the pandas DataFrame with all extracted features, so I did this for a summary file and the corresponding bam file. The code for processing and plotting is below, and indeed we see a decline in percent identity over time. Maybe running your flow cell as long as possible isn’t going to get you much more decent data?
https://gist.github.com/wdecoster/bd9ac9baa8f561952332ce756b0ec1e0