Genetic association
As I’m getting closer to the end of my PhD it doesn’t hurt to take a look at some basic genetic principles. Let’s start with genetic association, defined as “when one or more genotypes within a population co-occur with a phenotypic trait more often than would be expected by chance occurrence.” on Wikipedia. So we have genetic association if a certain allele is more common in a group with a certain trait, often a disease, compared to a control group.
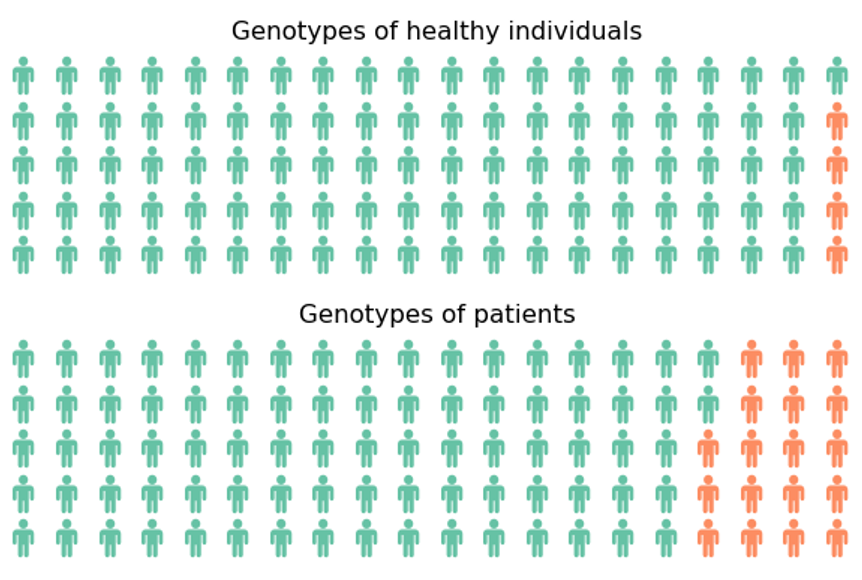
A visualization makes this easier to understand. Below you can see a waffle plot (thanks to Tokhir Dadaev for telling me that name!) showing the distribution of a genotype in a population of 100 healthy individuals and 100 controls. The code to generate this plot is pasted below and is based on PyWaffle.
https://gist.github.com/wdecoster/4365f71852520ebb9b7317ccd4ebd9a9
While we intuitively see a difference between those two populations, it’s important to prove this statistically. For this typically a Fisher Exact test is used, which is available for a 2x2 comparison in scipy.stats, returning the p-value and the odds ratio. In this case the pvalue is 0.0026 and we can consider this a significant association.
https://gist.github.com/wdecoster/103325cdaf93b8137c0d2c4f93d5325e