Announcing methplotlib: a genome browser for nanopore methylation data
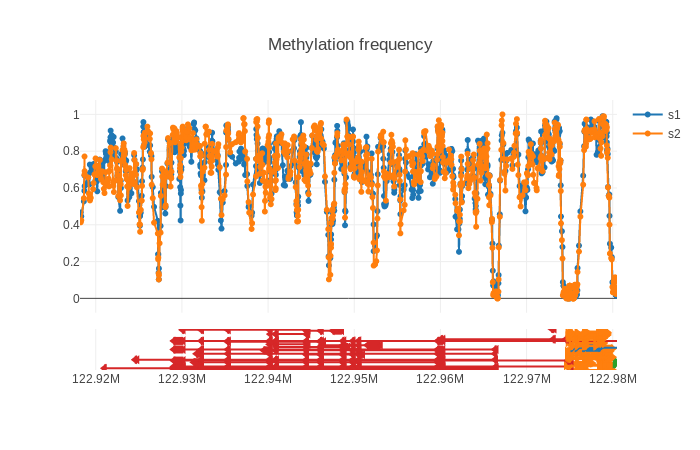
While finalizing my thesis I’ve spend some time on coding methplotlib, a genome browser for nanopore methylation data, currently tailored to nanopolish. It’s functional but not fully mature. By announcing it now I hope to get some input and feedback on how to improve the system. A screenshot of the end result, for two samples sequenced on PromethION, is shown at the bottom. A dynamic html example can be found here.
Currently my tool takes:
one or more files resulting from nanopolish calculate_methylation_frequency.py
names for the datasets
a window to plot (chromosome coordinates)
a GTF file (optional, actually)
It will create a html file (using plotly) with the methylated frequency. Under the hood it calculates a sliding window average to generate a smoother result, but perhaps this requires some more evaluation. It is currently quite slow if you want a very large region.
Happy to get some feedback and contributions!