Per base sequence content and quality (new basecaller)
A few weeks ago I blogged about the Per base sequence content and quality in nanopore sequencing data, which was performed on data from an earlier iteration of the basecalling tool. A newer version of Albacore (v1.0.4) incorporating a transducer (Scrapie) was released some time ago, and I recently upgraded our installation to v1.1.0. The main changes in this version are some bugfixes, directly outputting fastq format and an impressive speed-up. No drastic changes in the python wrapper, so I could still include my progress bar.
I wondered how the “Per base sequence content and quality” has changed, so I repeated the basecalling of the dataset used in the previous post. The code used is the same as in the previous post. There are some noticeable differences in the results, as you can see below.
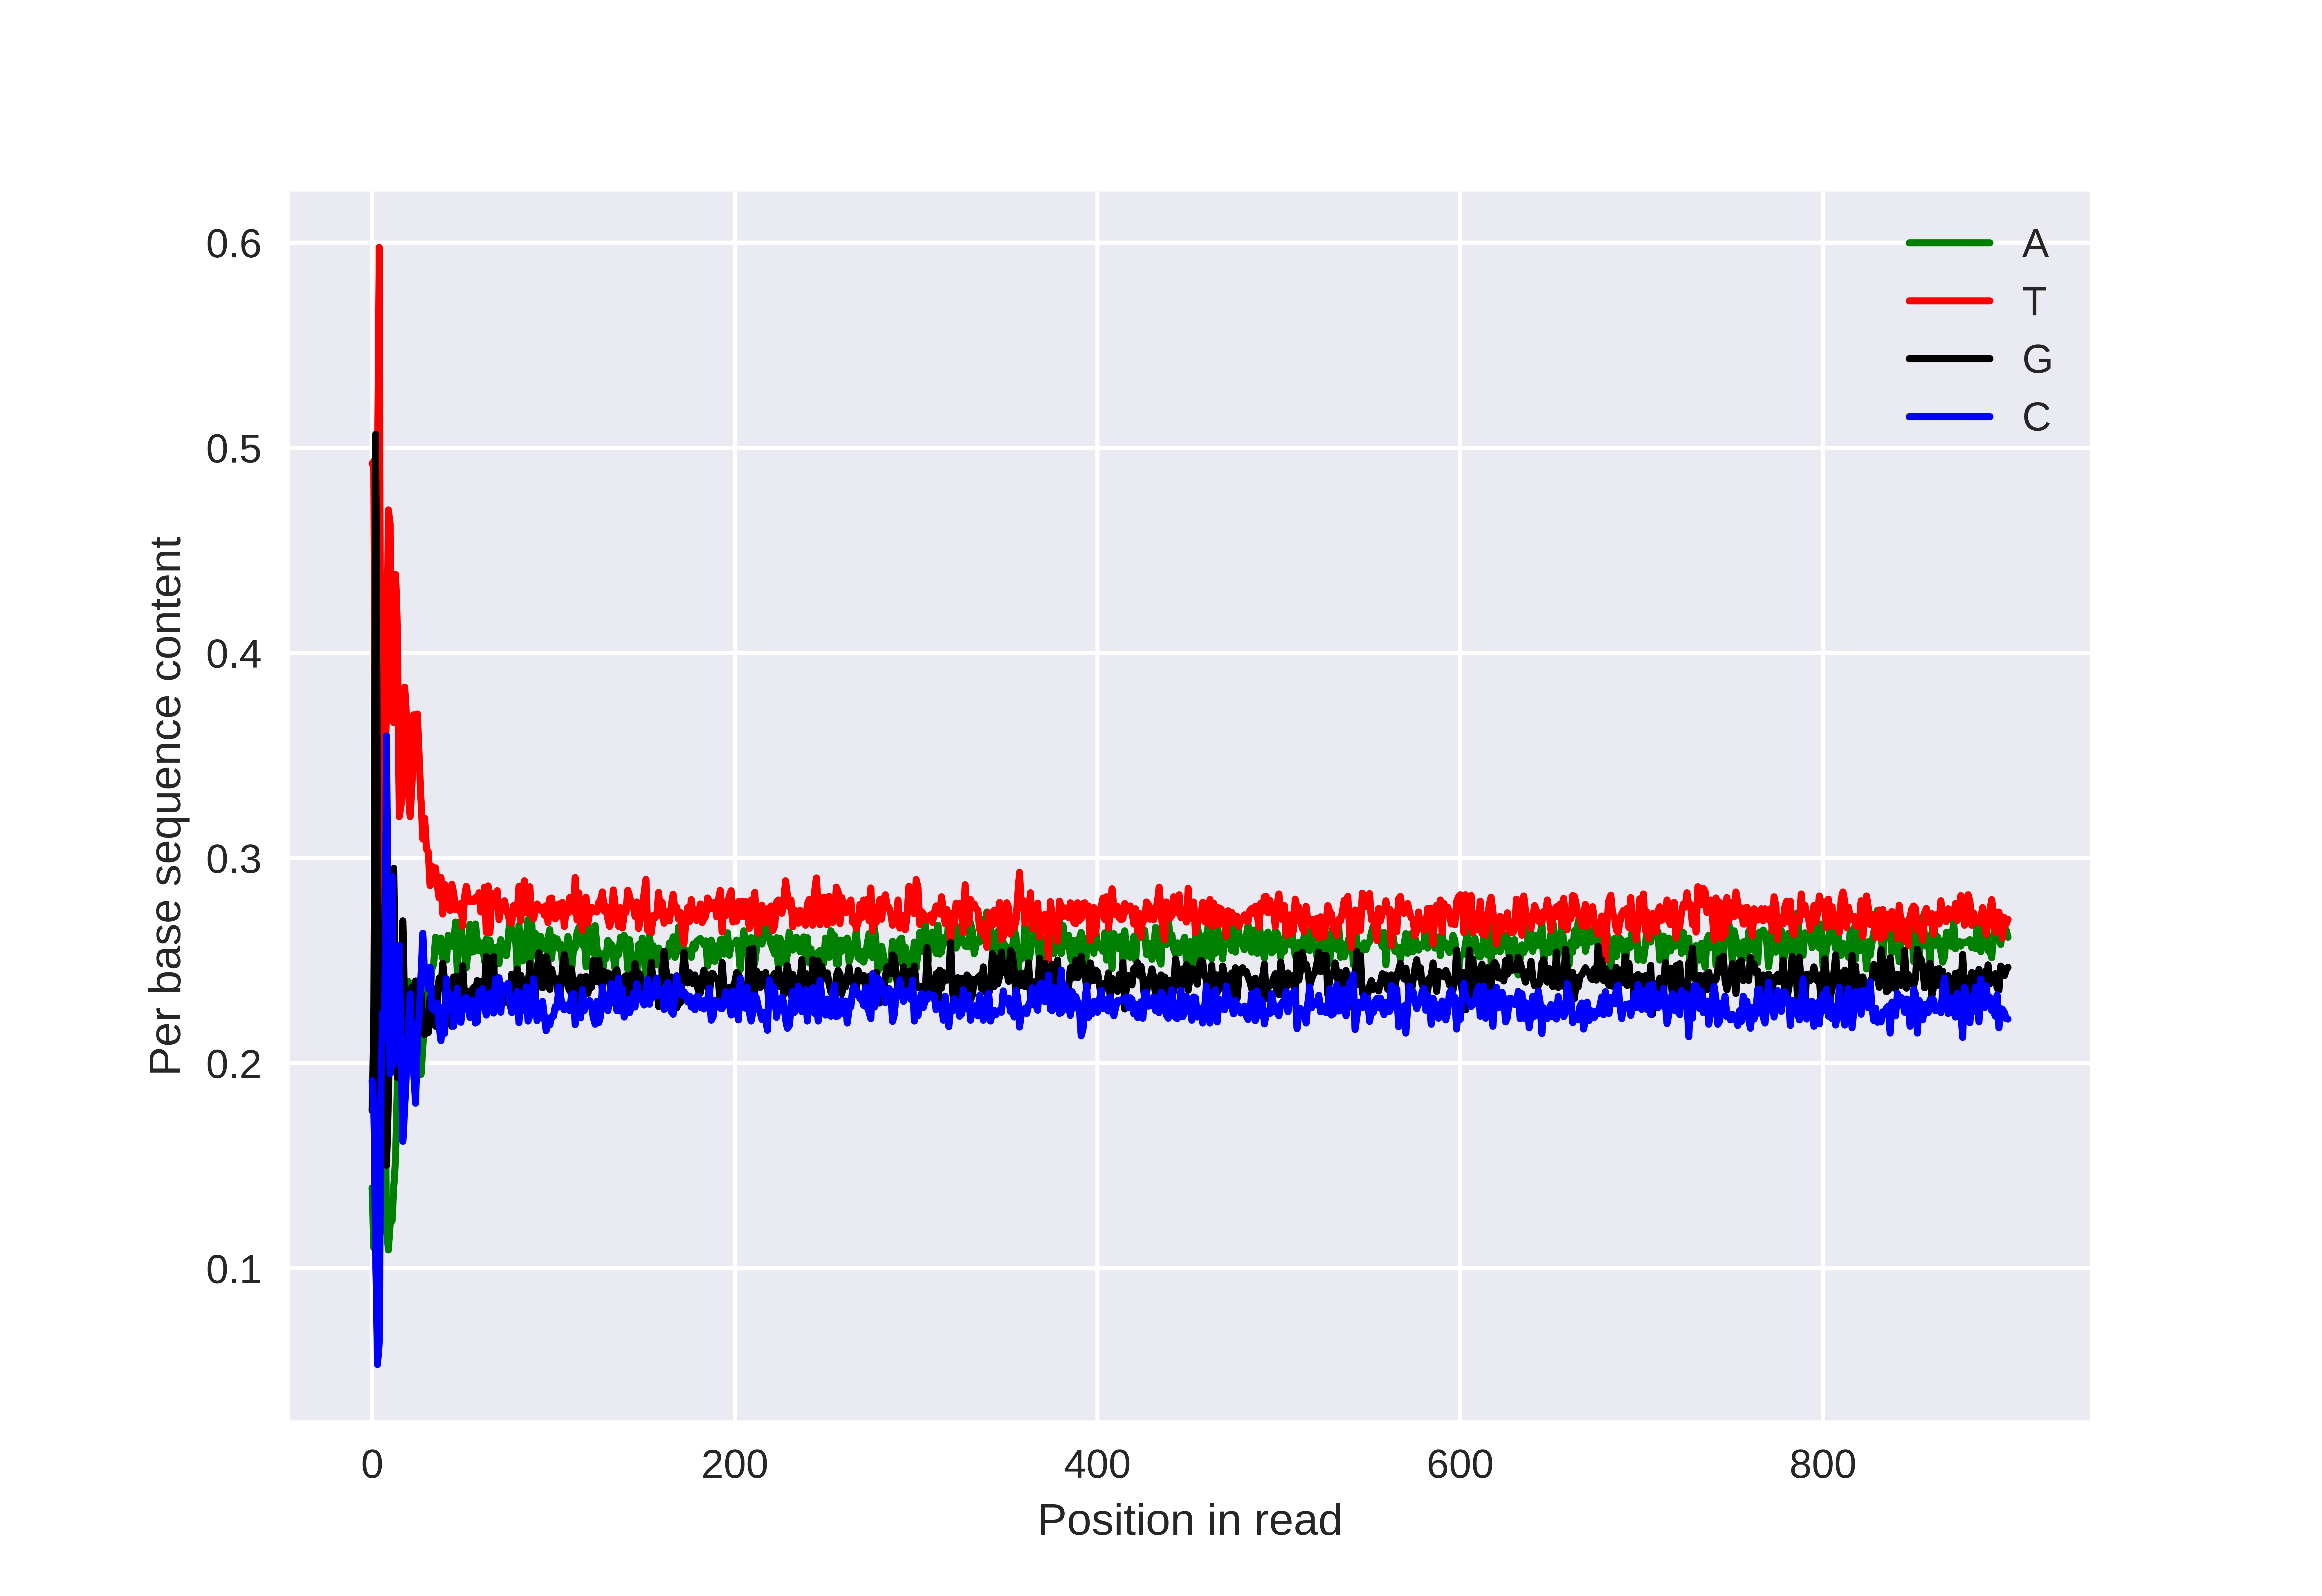
Relatively, more adenine nucleotides are called, getting closer to the overrepresented thymidine nucleotides. I decided to calculate the real nucleotide frequencies. This dataset is from the human chr1, so I wrote a script (see below) to do the counting. Running it takes quite a while, perhaps I should have chosen a different chromosome to do my experimenting on! The calculated distribution is (rounded to one decimal):
A: 29.1% T: 29.2% G: 20.9% C: 20.8%
This isn’t completely in agreement with what we see in the plot above. See also Chargaff’s rules for nucleotide distributions!
https://gist.github.com/wdecoster/2c8ea185505704326806fa7aed61dc40
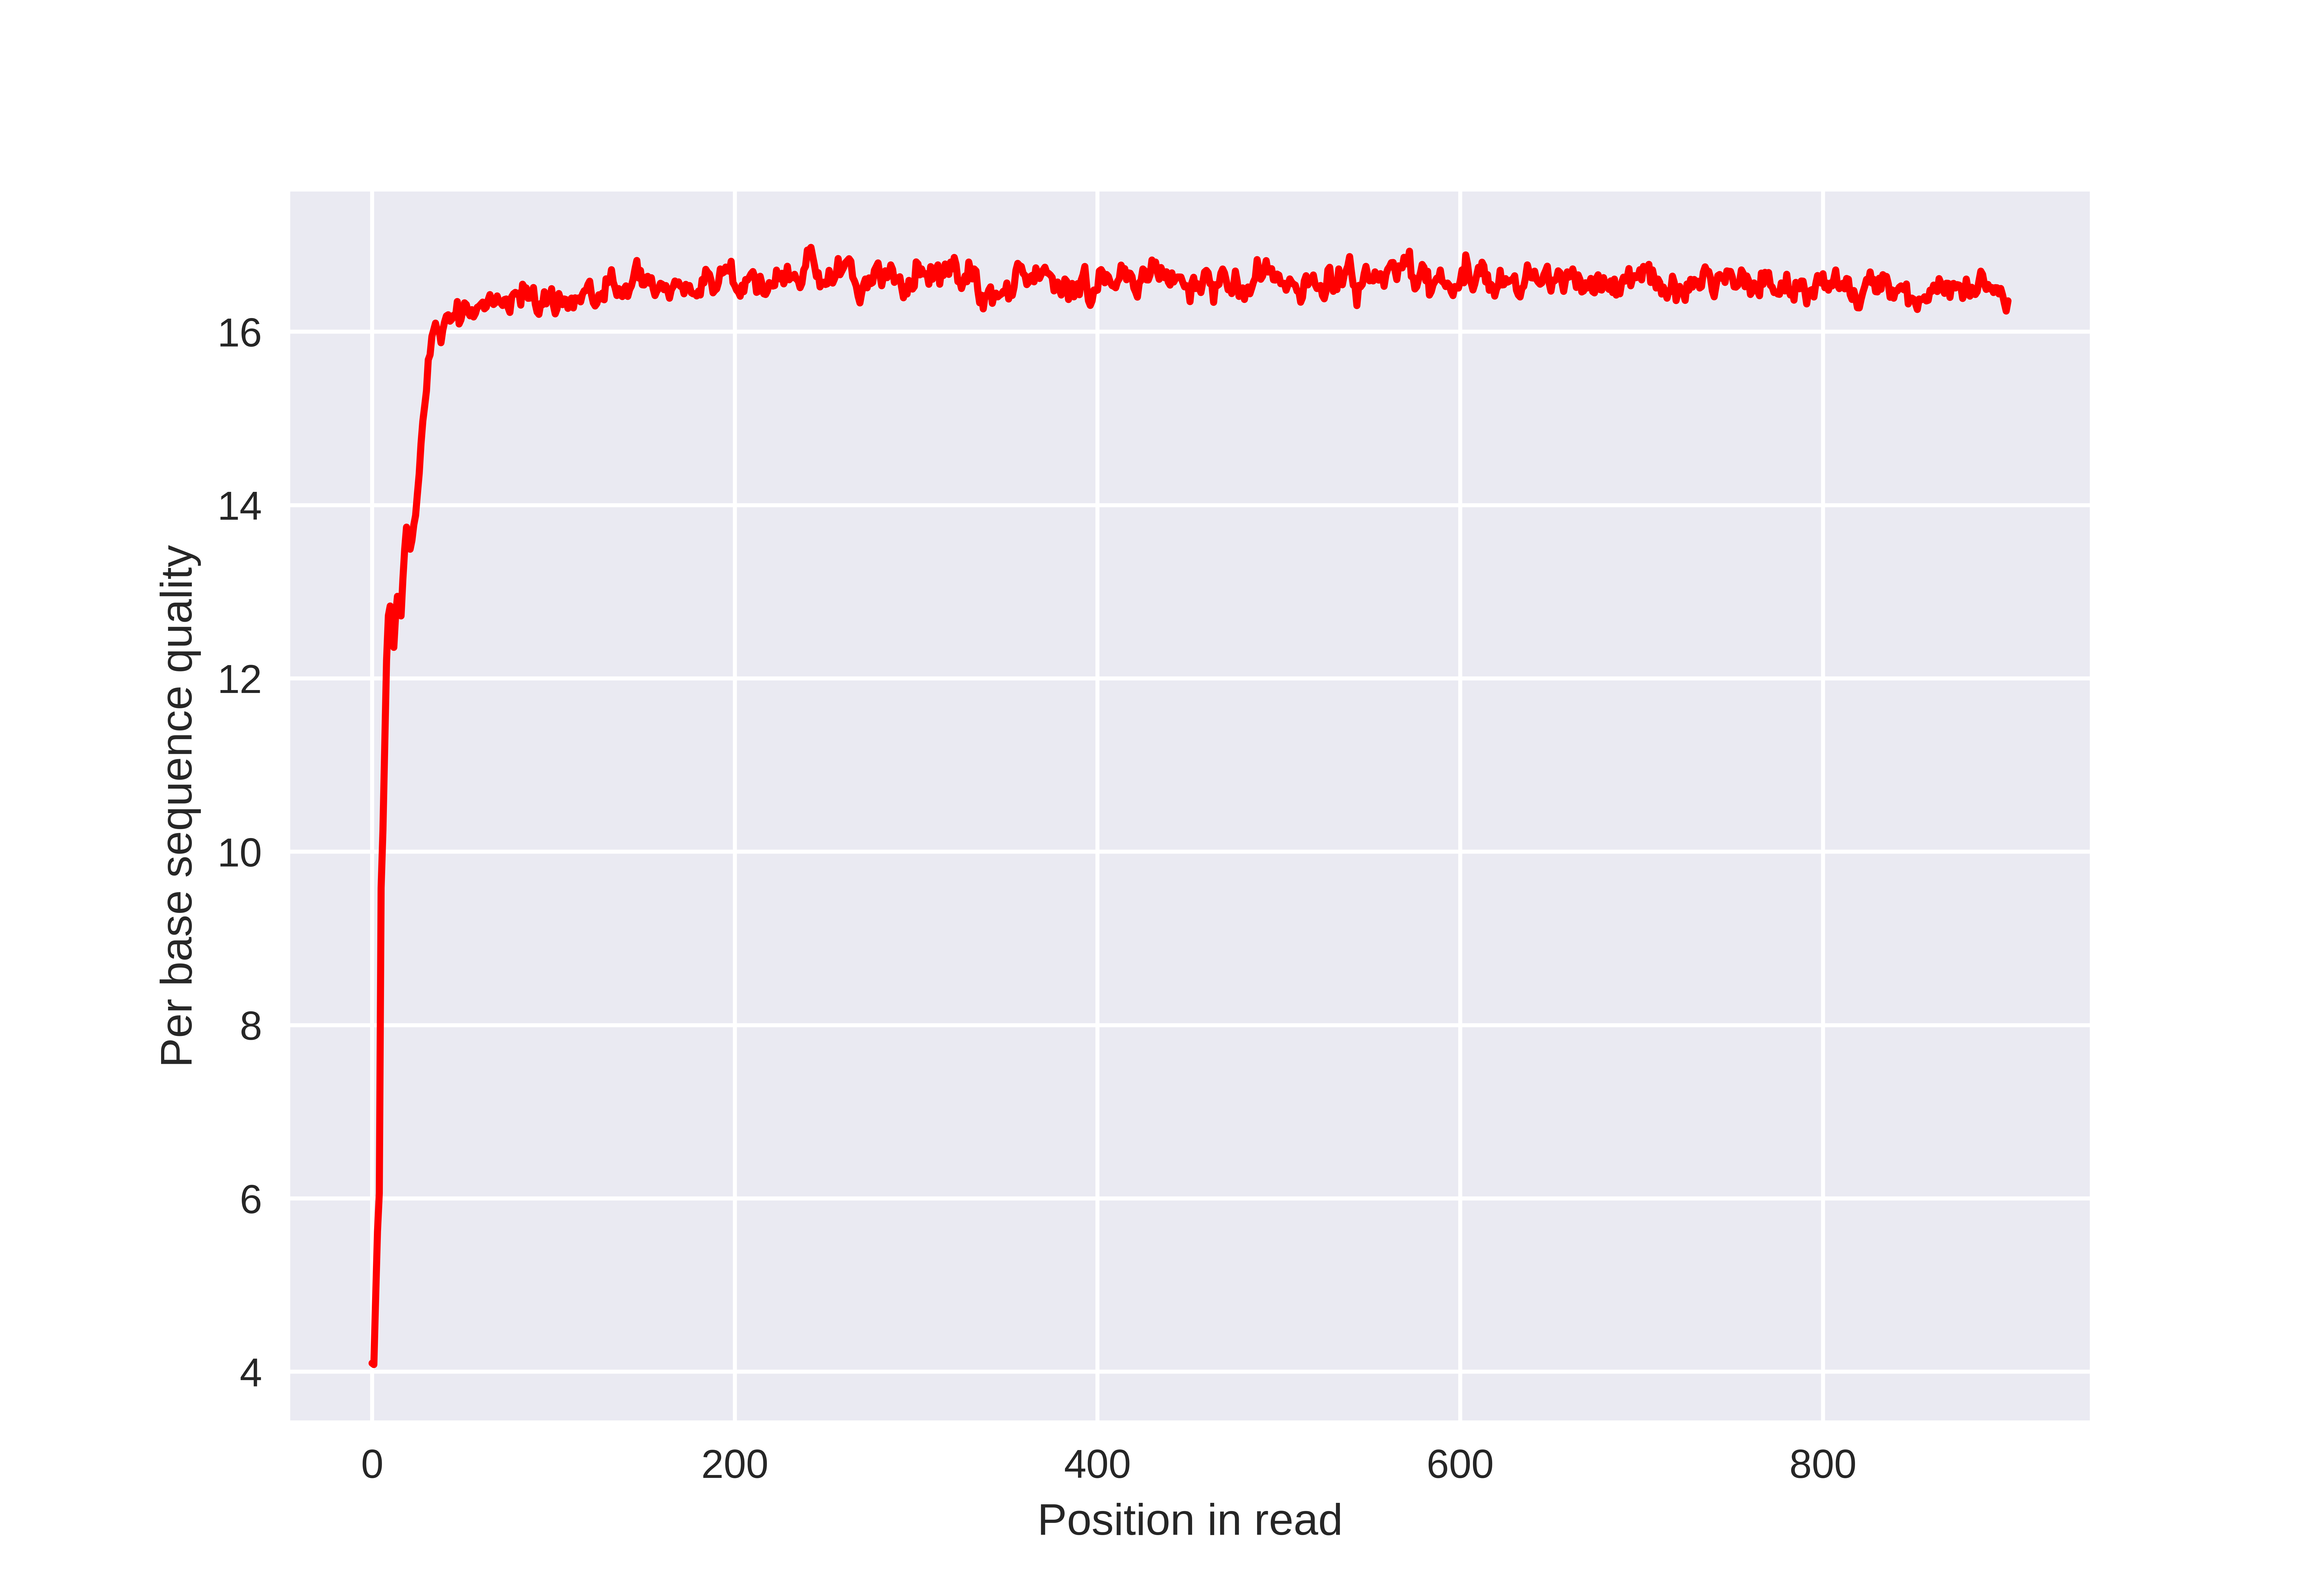
The average read quality got a drastic boost, from 8.5 to 16.5. I wonder whether this increase in confidence is justified, but that’s something for another post.